By Maddie Liberman
In this workshop, we create a map with different kinds of historical data. We will use this to see the change over time in a specific area of New York.
We’ll start out by downloading our data sources. We will be georeferencing a historical map and looking at the locations of saloons in 1883.
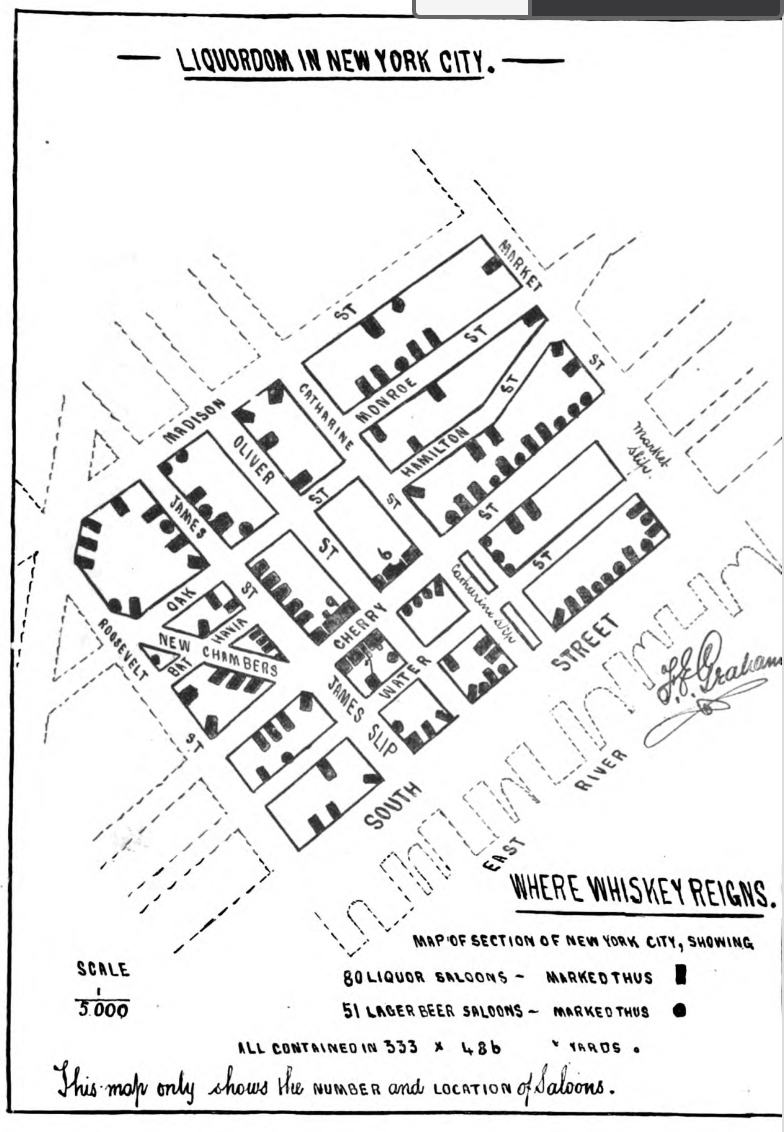
To download the map, visit this link. This will take you to a scan of the “Liquordom in New York City” pamphlet made by Robert Graham, the secretary of the Church Temperance Society, in 1883. Scroll to page 14 of 40 and click the “Download” button on the left side to download the page as a PDF. Then download the shapefiles of modern building footprints and borough boundaries.
Next, we will open up QGIS and start a new project. On the left Browser pane, expand “XYZ tiles” and drag the OpenStreetMap basemap into the main map frame. Use the magnifying glass tool and the hand tool (pan) on the top toolbar to zoom in to Manhattan.
Next, we will georeference the map of saloons. Georeferencing is a process where we take an outside map, such as a historical map, and match it up to modern-day geography. We can see the exact location that this map depicts on top of a modern day map. To do this, navigate to the “Raster” tab and choose “Georeferencer.” This will open up a new georeferencing window.
Choose the blue checkerboard icon at the top left (or navigate to File -> Open Raster). Find the PDF we downloaded and click “Open.” The map will appear in the georeferencing window. To match it to the modern street map, we will need to add what are called “control points.” These are points that are in the same location on the map we’re georeferencing and the modern map. QGIS will match up these points on the two maps.
To add control points, click on the gray airplane-shaped button with the yellow star. Click on a point on the saloon map. It’s helpful to choose street intersections, as these are points that you can easily match up. Once you click on a point, a window pops up asking you to enter the matching coordinates on the modern map. You can either enter the coordinates manually, or choose them on the map- what we’ll be doing. Click “From Map Canvas” and navigate to the matching location in the street map. It might take a few minutes to find the general area! Once you’ve found it, minimize and reopen the QGIS window, and the popup should reappear. Click “From Map Canvas” again and choose the location in OSM. A new control point is added below the map in the georeferencing window.
(If you need help finding the location in Open Street Map, you can search the Open Street Map by installing the OSM Place Search plugin: Plugins -> Manage and Install Plugins, then search “OSM place search” and click “Install Plugin.” A window will appear on the left side of QGIS where you can search street names. Double click the result to navigate to that street.)
Repeat this process for 5-8 points, spreading them out across the map. Generally, more is better for a larger-scale map like the one we’re using. Once you’ve finished adding points, go to Settings -> Transformation Settings, or click the yellow gear icon. Keep the transformation parameters (the top section) the same. Under “Output Raster,” click the three dots and choose the folder where you’d like to save the georeferenced map. Add a new title, or keep the default. Make sure that “Save GCP points” and “Load in QGIS when done” are selected, and then click “OK.” Then click the green play symbol on the top toolbar to georeference the map. The map should appear in the main QGIS window.
The map appears over our modern street map. To see the street map underneath, right click the georeferenced map in the Layers pane, click Properties, and then adjust the transparency slider in the Transparency tab until you can see both maps.
Now that we’ve added the 1883 map, we’ll add in some modern buildings and borough boundaries. Add the building footprints layer to the map; all of the buildings in New York appear. We want to highlight just our map area, so we’ll create a new layer that only contains those buildings. To do this, click the “Select Features by Polygon” tool on the toolbar (looks like a mouse over a yellow square). Draw a polygon along the streets around the buildings that appear in the historical map, then right-click when you are finished. The buildings turn yellow, indicating that they are selected.
Right-click the buildings layer in the layers pane and go to Export -> Save Selected Features As… Change the file name to buildings_selection and save it in your project folder. Check “Add saved file to map” and click OK. A new layer is created with only the buildings in our area of interest. You can now right-click and remove the layer with all of the buildings. Finally, add in the borough boundaries layer. We can now turn off the Open Street Map layer to simplify the map.
We will now mark the locations of 1883 saloons on the modern-day buildings (although since this is a unique hand-drawn map, they may not line up exactly). Navigate to Layer -> Create Layer -> New Shapefile Layer. You can call the file “saloons” or something similar. Keep the geometry type as “Point,” then click OK. The empty point layer is added to the layer list.
To add points to the layer, click the pencil icon on the toolbar and then the “Add Point Feature” icon to the right. Make sure that the map layer is above the buildings layer in the layer list. Now you can place points on top of the historical saloon locations to show where they are in relation to modern buildings. After you make each point, you will be prompted to add a unique ID; you can just number the points consecutively. Don’t worry about marking every saloon on the map; we’ll just do a few in this example.
When you are finished, click the Save icon to the right of the pencil, and then click the pencil to finish editing. Make sure that the saloons layer is above the buildings layer so that you can see it.
(could also use OSM to make another point layer of modern bars and compare across time)
Now we will set up a layout for the finished map. (layout process from another QGIS workshop)
(Final product: a large-scale map of this Manhattan neighborhood, marking the historical saloons)
Leave a Reply