Led by Maddy Liberman, Undergraduate ERC Fellow
Today we will be using Mapbox to make custom Halloween-themed maps! Mapbox is a web browser map platform. Many apps and websites use it for basemaps, such as CNN, Instacart, and the New York Times. I’ll show you some examples from https://www.mapbox.com/showcase. Mapbox has many advantages in that it’s free and requires no downloads. A caveat is that your styles can only receive a certain amount of views on the free plan- but you probably won’t hit that limit. So why use Mapbox? It’s great for custom designed basemaps, and you can use these styles for your own apps and websites.
To get started, we’ll create an account. Click “Sign up for Mapbox” and enter the information, then click “Get started.” You’ll need to verify your email. Click “Create a Map in Studio.” You’re taken to a list of all of your Styles, which is empty at the moment. A style is a set of rules that customize the appearance of your map. Click “New Style.” You are given some basemap templates; we’ll use the Monochrome template just to get started. You can choose a color palette, but we’ll be changing it anyway. Click “Customize Monochrome” at the bottom.
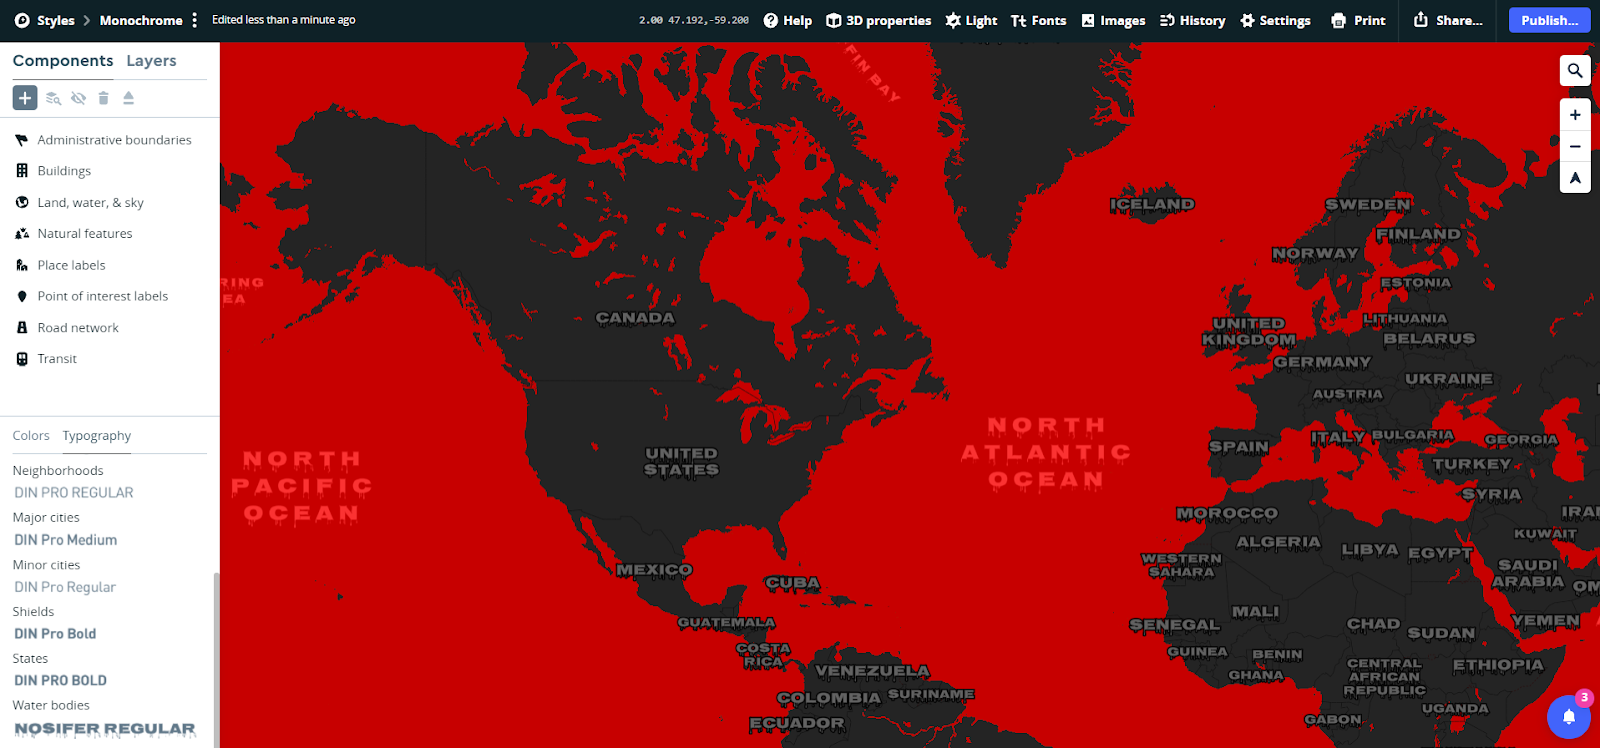
The map opens up in Mapbox. Let’s start by changing the name of the style. On the top black bar, to the right of “Styles,” change “Monochrome” to a name of your choice. I’ll change mine to “Spooky Style.”
On the left side, you’ll see tabs for Components and Layers. A component is a set of one or multiple types of features that are styled the same way. For example, some of Mapbox’s components are buildings and natural features. Each component contains multiple layers. Similar to QGIS or ArcGIS, a layer in Mapbox is a set of features of one type.
At the top of the Components pane, there are a few different features. You have to click on a component to be able to use these. The plus sign allows you to add new components. The eye shows or hides components and the trash can deletes them. The last symbol is the “Eject” tool, which dissolves the component group and makes all of the layers individual instead of a single unit. You’ll only want to use this if you want to edit a lot of layers individually or change the order of a component’s layers.
Now we’ll start to customize the style. The first thing we can change is the color palette of the entire map. At the bottom of the left pane, under Colors, click the icon next to Base to bring up the color picker. You can now change the color of the entire map to something creepy- maybe orange or blood red. But we’ll also change layers individually.
If you click “Manage Colors,” you can add components and choose their colors. Click the plus sign next to “Water”; now we can change the water color.

We can also customize the map font. To find a fun font, we’ll go to https://fonts.google.com/. In the search bar, you can try searching “spooky,” “creepy,” or “Halloween,” or you can scroll through all of the fonts. Make sure to select a font that says “1 style” at the top and doesn’t have an arrow, as those fonts may not be free. I like Creepster, Nosifer, and Flesheater. When you’ve found one that you like, click “Download Family” to download a zipped folder. Extract the files to somewhere you’ll find them. Then in Mapbox, navigate to “Fonts” on the top toolbar and choose “Upload New Font.” Browse to the place where you extracted the folder and choose the .ttf file. This may look a little different on your computer.
Now that the font is uploaded, we can add it to the map by going to the Typography tab to the right of Colors on the left pane. You’ll see a list of all of the text labels that Mapbox uses, which you can change individually. Click on the “Countries” layer; you’ll see that we can adjust the size of the labels in addition to the font. In the box, type the name of the font you downloaded and click on it to change the font on the map. You may need to zoom out to see the new country labels. You can do this for multiple label layers.

I’d like to adjust the text appearance a bit more so that I can see the dripping blood better. To do this, we’ll go to the Layers tab. Here we have options to edit all of the individual layers that make up each component. I’ll first go over a few features at the top of the Layers tab. Some of these are the same as the Components tab, but you can also group and duplicate layers.
Expand Place Labels to see all of the layers within this component. First I’ll click on the country-label layer to edit it. Now there are many available options to edit the text. All of the fields that have a padlock sign next to them are controlled by the component as a whole, but we can override this to customize the layer. Choose “Color” in this pane and click the “Override” button. You can then choose a color for the inside of the text. To change the outline, choose “Halo color” and Override again. If at any point you’d like to reset to the default options, you can click the “Revert” button.

We can also change the color of administrative boundaries. Expand this component and click on the second layer, and repeat the same process to change the boundary color. Mapbox allows you to input hex color codes, so you can copy and paste the same code from before if you’d like to match the colors. You can also change the boundary width underneath. For the third layer, you’ll notice that the line color is a gradient. The line color changes depending on how far the map is zoomed in. You can change the colors in the gradient as well. This is a great design tool because you can emphasize different features at different scales. The same process applies for editing the road colors- choose the component Road network surface and click on road-primary.
As you can see, there are many more layers to edit. This can get overwhelming because there is so much flexibility. However, you don’t need to change anything, and just a few small edits can really make a lot of difference.
While Mapbox has great options for basemaps, we can also add and visualize our own data! Visit erc.barnard.edu and click on the Workshops tab, and find the Map Club link to download the dataset we’ll be using. This is a dataset of haunted places in the U.S. We will be using a .CSV, but Mapbox also accepts shapefiles (spatial files).
To add the layer into Mapbox, click the plus sign at the top of the Layers tab. Click on Source and then “Upload Data.” Drag and drop the CSV or find it in your file explorer. The CSV has a latitude and longitude column, so Mapbox automatically creates points to represent the locations. This may take a minute. When you see the “Success” message, click on “None selected” under Source and find the haunted_places layer in the menu.
If you zoom in on the map, you’ll notice that the haunted locations are represented with circles. We can change this by adding custom icons. Mapbox uses .SVG files for icons, which we can find for free on https://www.svgrepo.com/. Search “Halloween” or something else to find many icon options. When you’ve found one you like, hover over it and click the “download SVG” button. Now on the top bar of Mapbox, click on “Images” and “Upload Images.” Find your downloaded SVG file.
Now go back to the Layer options (the haunted-places layer is on top) and go to “Select data” -> symbol. Under Image, choose your SVG file. You won’t see it at first. Mapbox takes a minute to update the image, and the SVG is also probably too large. Change the size to 0.05 and refresh the page. The size stays the same as you zoom in and out, but we can also choose “style across zoom range” to make the size decrease as we zoom out. Right now, the icons are also not overlapping, so we can’t see all of the locations. We’ll fix this by going to the Placement tab -> “allow icon to overlap.”

When you are satisfied with your map, you can click Publish in the top right corner. This allows anyone to use this style as a basemap in an app! You can also print the map at the current extent by choosing “Print.” If you want to use this style for a map in a website, you can click Share and copy the website embed code.
This is just an intro to all of the possibilities with Mapbox! There are endless possibilities, and Mapbox allows you to get incredibly detailed in terms of your styling. There are also many more options for data visualization. Mapbox has many free tutorials to help you learn more, and you can find these by going to https://docs.mapbox.com/ and click on Help. Thanks so much for coming today, and have fun mapping!
Leave a Reply