By Neeti Kapadia
We will be running an F-test on two stock indexes from Denmark and Sweden on their closing prices data from March through May 2020. More specifically, we will be looking at the closing prices of their most traded stock indices, the OMXC and OMX respectively.
Both Denmark and Sweden are quite similar societies, but had very varied responses to the COVID-19 Pandemic. Both countries have wealthy economies, strong institutions and strong governments. However, the countries implemented very different responses to COVID-19, Denmark went into a full shutdown in March and began to reopen in May, whereas Sweden did not impose such strict lockdown restrictions and continued to suggest recommendations to its citizens.
An F-Test is used to test the null hypothesis that the variances of two datasets are equal.
To run an F-test, follow the steps below:
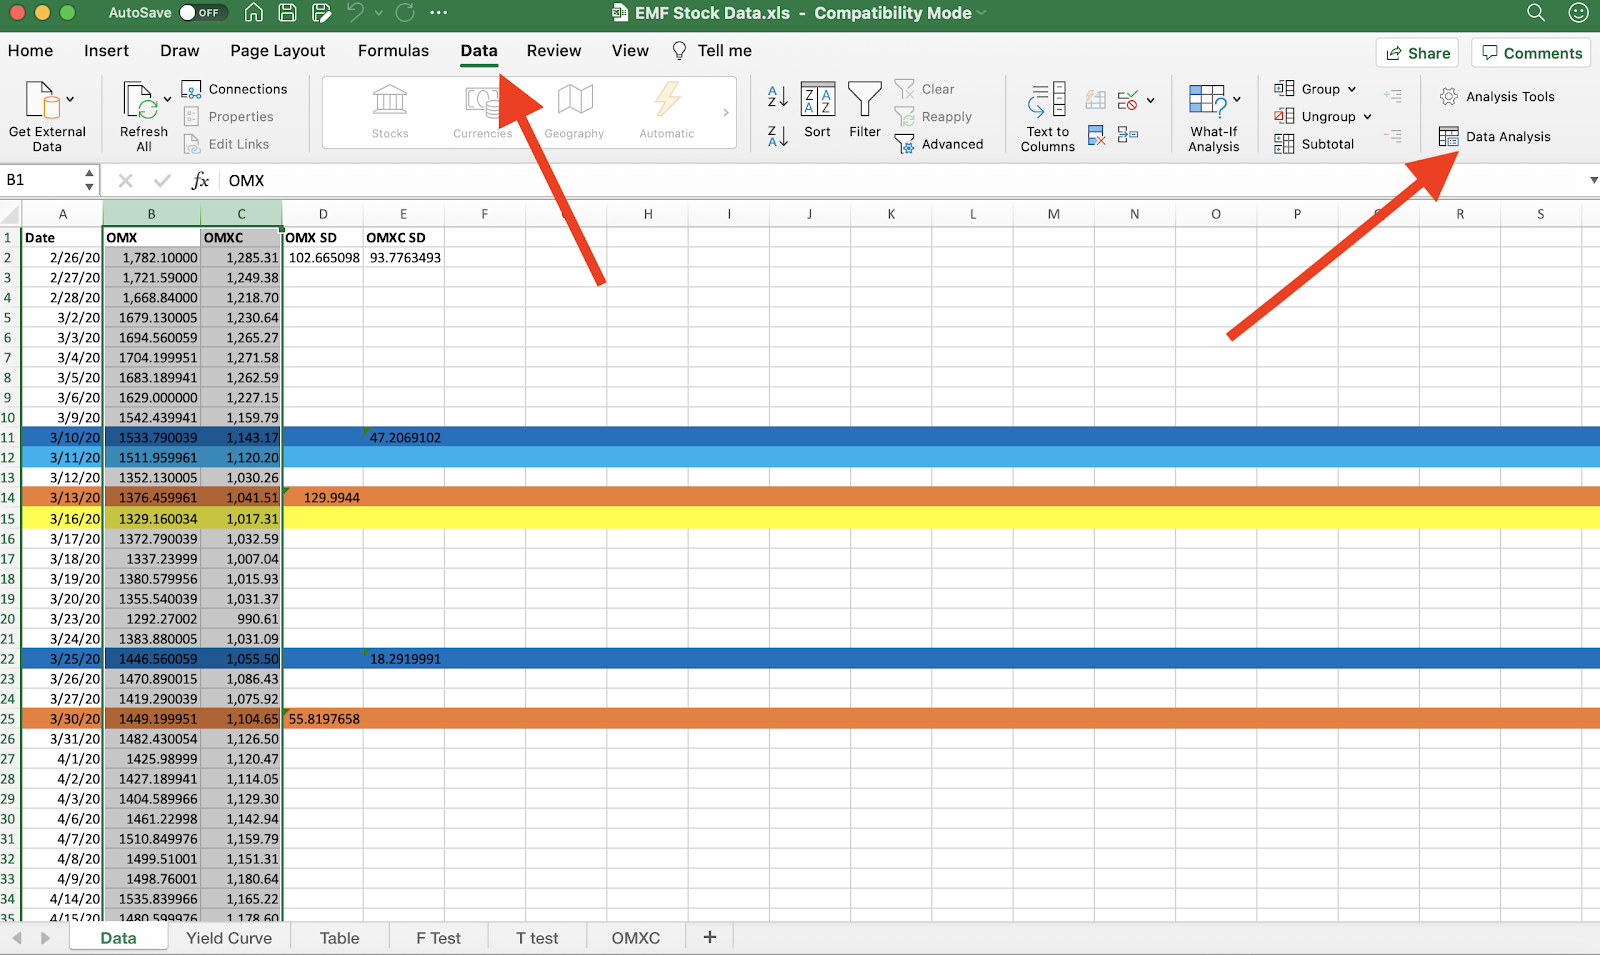
- Go to the sheet with your data. Under the data tab, there will be a button called Data Analysis.

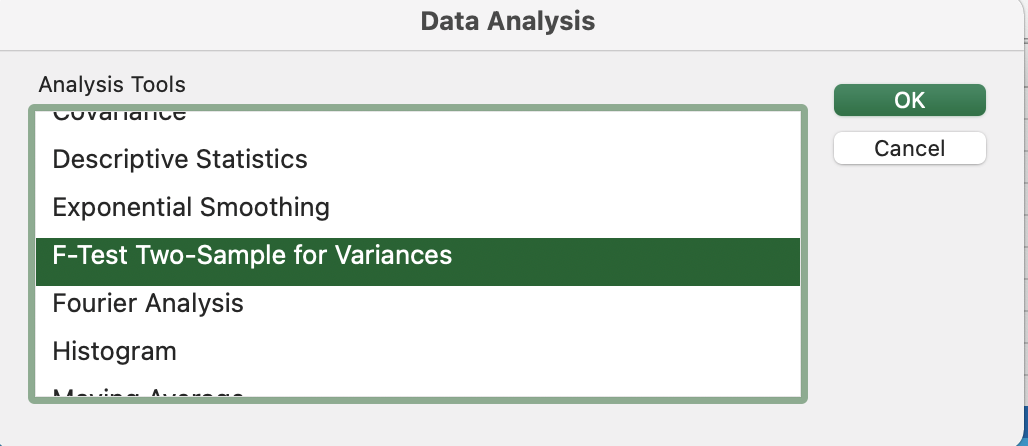
- After clicking on Data analysis, you will be brought to a variety of options. As seen below, you can run a T-Test, Z test, regression and more. For an F-Test, click on F-Test and you’ll be brought to another screen.
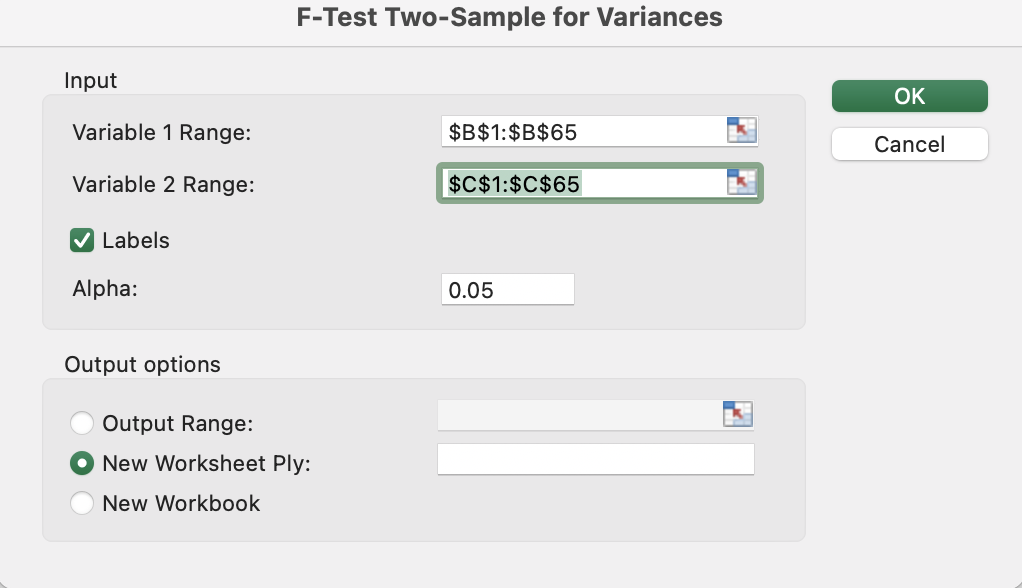
- Next, highlight the data that you want to use. To include the headers, tick labels. I wanted to clearly see the difference in the data between the OMX and OMXC indexes.
- Once you click ok, a new sheet will be created with the F-Test.

In this data set, you can see the mean for both indices, the variance, the amount of observations, degrees of freedom, the F value, the P-value and F critical value for one tail. With an F-Test, the closer the F-Value is to one, the less different the two variables are. The F value for both data sets was 1.09294703273016, showing that the data was not significantly different. However, the p-value was above the 0.05 level, demonstrating that there is no statistically significant difference between the two indices. From the F-test, it is reasonable to conclude that there was limited difference in the scale of volatility between the two indices, even though the charts may depict otherwise. The hypothesis was that the OMXC index would experience less volatility, but after running this F-test, we can conclude that there was no statistically significant difference between the two indexes volatility for the period analyzed.
Bibliography
Andersen, Asger Lau, et al. Pandemic, Shutdown and Consumer Spending: Lessons from … University of Copenhagen, 12 May 2020, arxiv.org/pdf/2005.04630.pdf.
Cox, Natalie, et al. “Initial Impacts of the Pandemic on Consumer Behavior: Evidence from Linked Income, Spending, and Savings Data.” Brookings Papers on Economic Activity, 25 June 2020, doi:10.2139/ssrn.3633008.
“What Do Different Yield Curve Shapes Mean?” JP Morgan Chase, JP Morgan Chase, Mar. 2016, am.jpmorgan.com/blob-gim/1383243044307/83456/what-do-different-yield-curve-shapes-mean.pdf.
Yeung, Kit, and Federico Barriga Salazar. “Fitch Affirms Sweden at ‘AAA’, Outlook Stable.” Fitch Ratings: Credit Ratings & Analysis For Financial Markets, Fitch Ratings, 5 June 2020, www.fitchratings.com/research/sovereigns/fitch-affirms-sweden-at-aaa-outlook-stable-05-06-2020.
Yeung, Kit, and Greg Kiss. “Fitch Affirms Denmark at ‘AAA’; Outlook Stable.” Fitch Ratings: Credit Ratings & Analysis For Financial Markets, Fitch Ratings, 4 Sept. 2020, www.fitchratings.com/research/sovereigns/fitch-affirms-denmark-at-aaa-outlook-stable-04-09-2020.
Leave a Reply